Reading fall color from space, one view at a time
Kathryn Wheeler, Ph.D. · Code on GitHub
Cool air, darker mornings, flannel shirts, leaves crunching underfoot, golden forests, hotels packed, restaurant reservations booked. Every fall, people travel from all over to catch the leaf colors in the Berkshires, and a lot of them plan to hike on the Appalachian Trail. Before heading out, they will likely check their favorite weather app (or two) to see current conditions and the forecast. If it is rainy, they might wait until the next weekend. There is no equivalent for the leaves. So I built one. It uses satellite data to show where along the Trail the leaves are likely changing each day, so you can pick a section worth walking this weekend or hold off for the next.
The timing of color change matters for more than the view. It marks the end of the growing season, when deciduous trees stop taking up carbon dioxide from the air and enter winter dormancy. That timing lands in roughly the same window every year, but due to year-to-year weather the exact date varies. Warmer autumns and more frequent droughts due to climate change can shift the window more dramatically. Droughts typically advance color change, and warmer autumns delay it. This makes leaf color change one of the more visible ways to observe climate change in the northeastern forest. Leaf color change is part of phenology, which can be thought of as seasonality.
Updated every morning from the latest NASA HLS satellite imagery.
More than just looking at one number
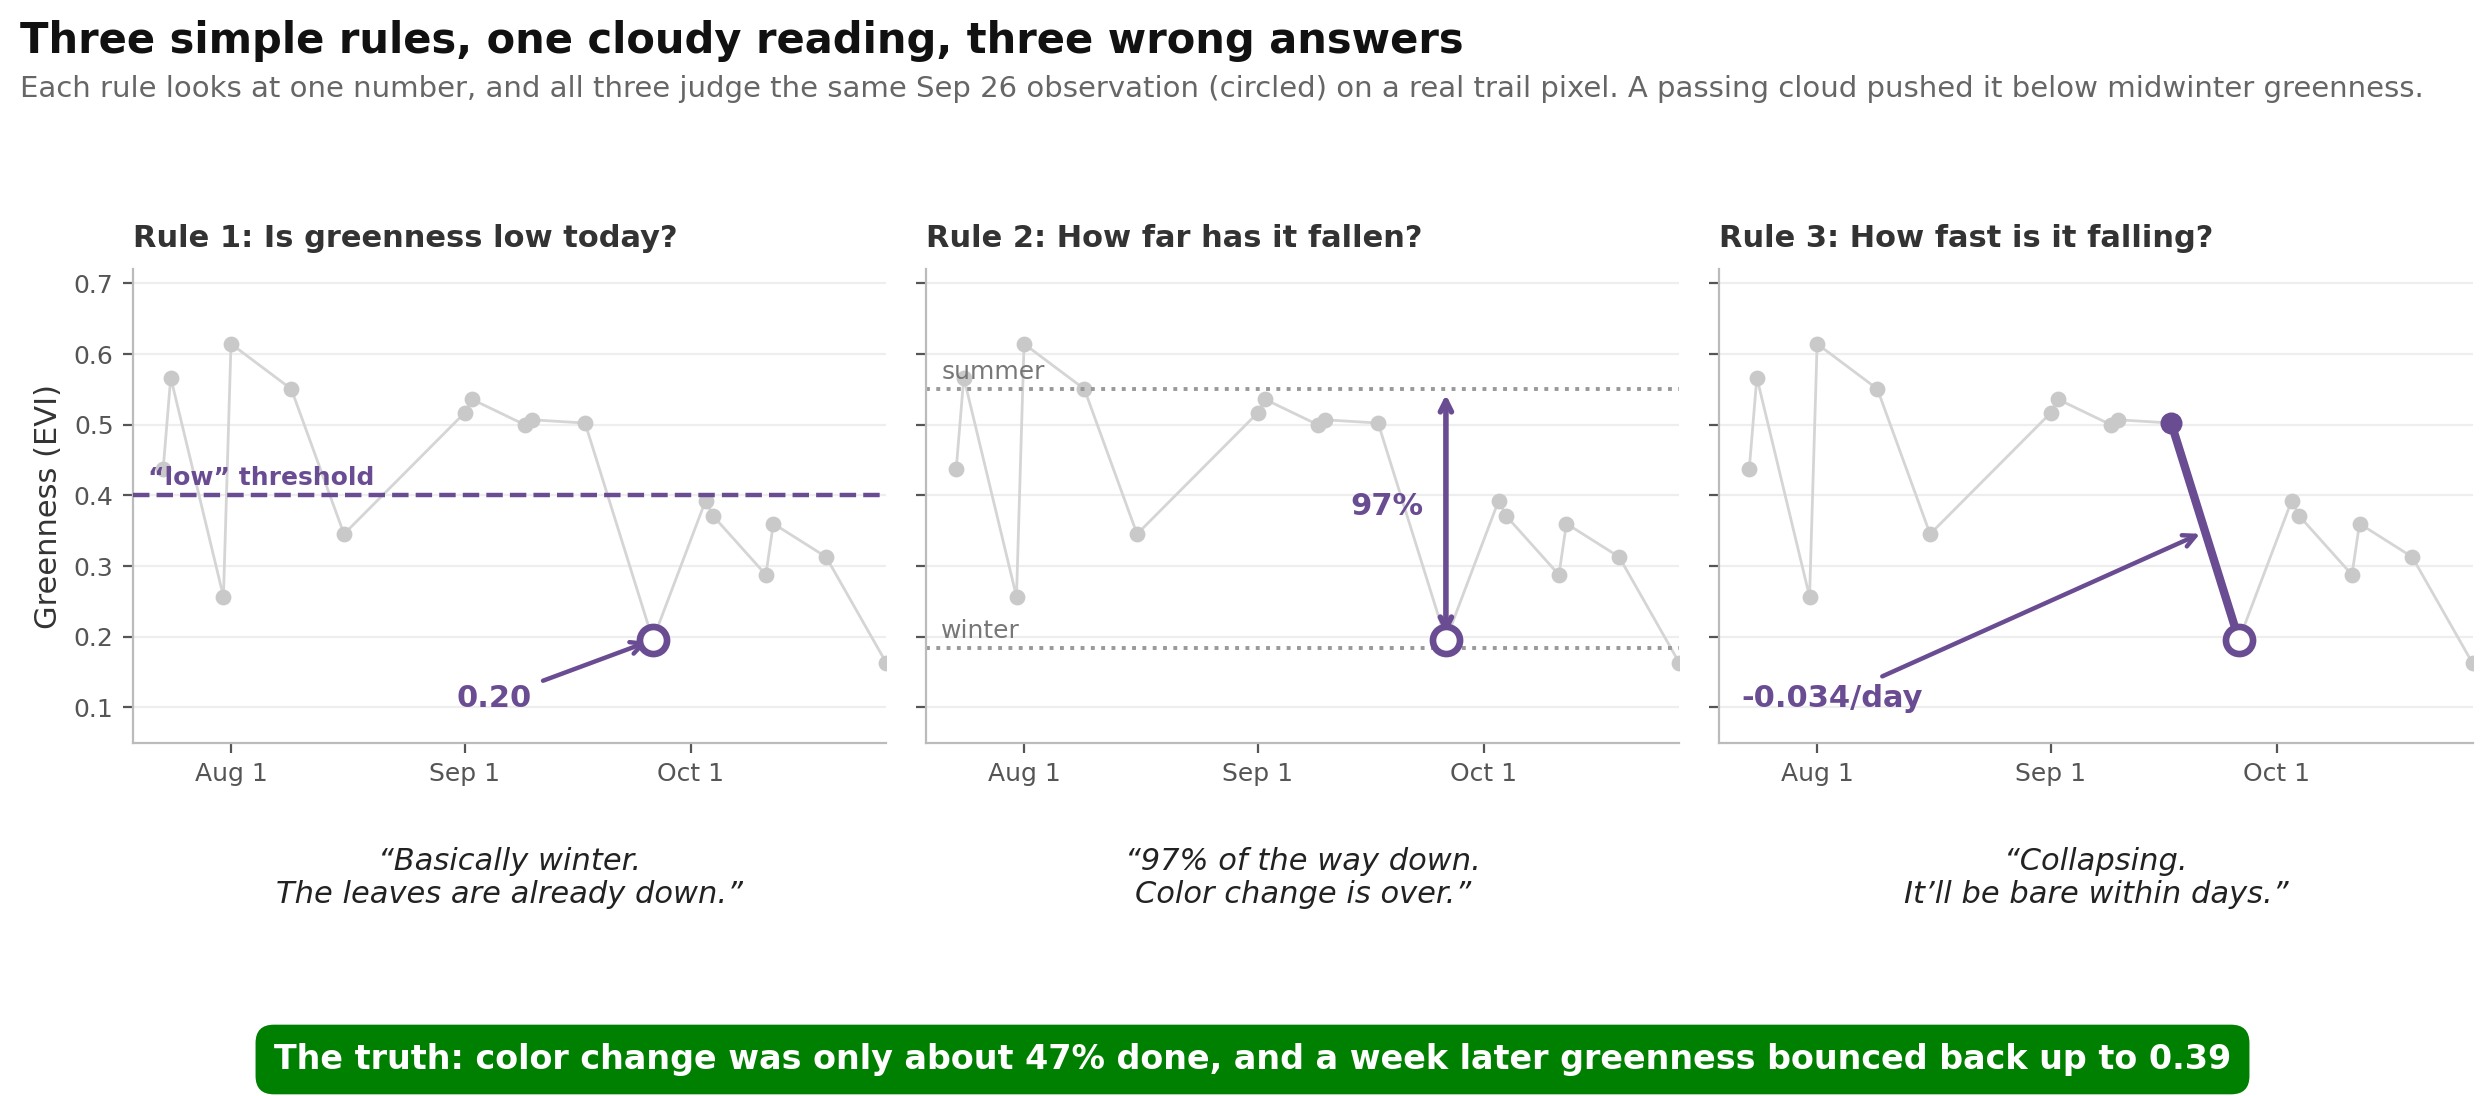
Each rule looks at one number. A single cloudy reading on September 26, 2023 pushed greenness below midwinter levels and fooled all three.
You could try to determine color change occurrence with a single rule such as the greenness dropped below some number, decreased a certain percentage compared to peak summer, or decreased at a faster rate. Each of these, however, relies on a single number that is sensitive to noise. The cloudy day above illustrates this.
Smoothing the data lessens the noise but by doing so makes it difficult to track the precise start and end of greendown (the full curve of green to bare). Assessing the greendown curve (see below) to determine the start and end requires having the entire season (or most of it). Waiting until the end does not help today's hiker plan their adventure.
The models I trained work differently and take in various inputs to estimate where in the greendown curve the pixel is today. In remote sensing terms, this is a land cover change problem, except the seasonal state of the land is changing and not its cover.
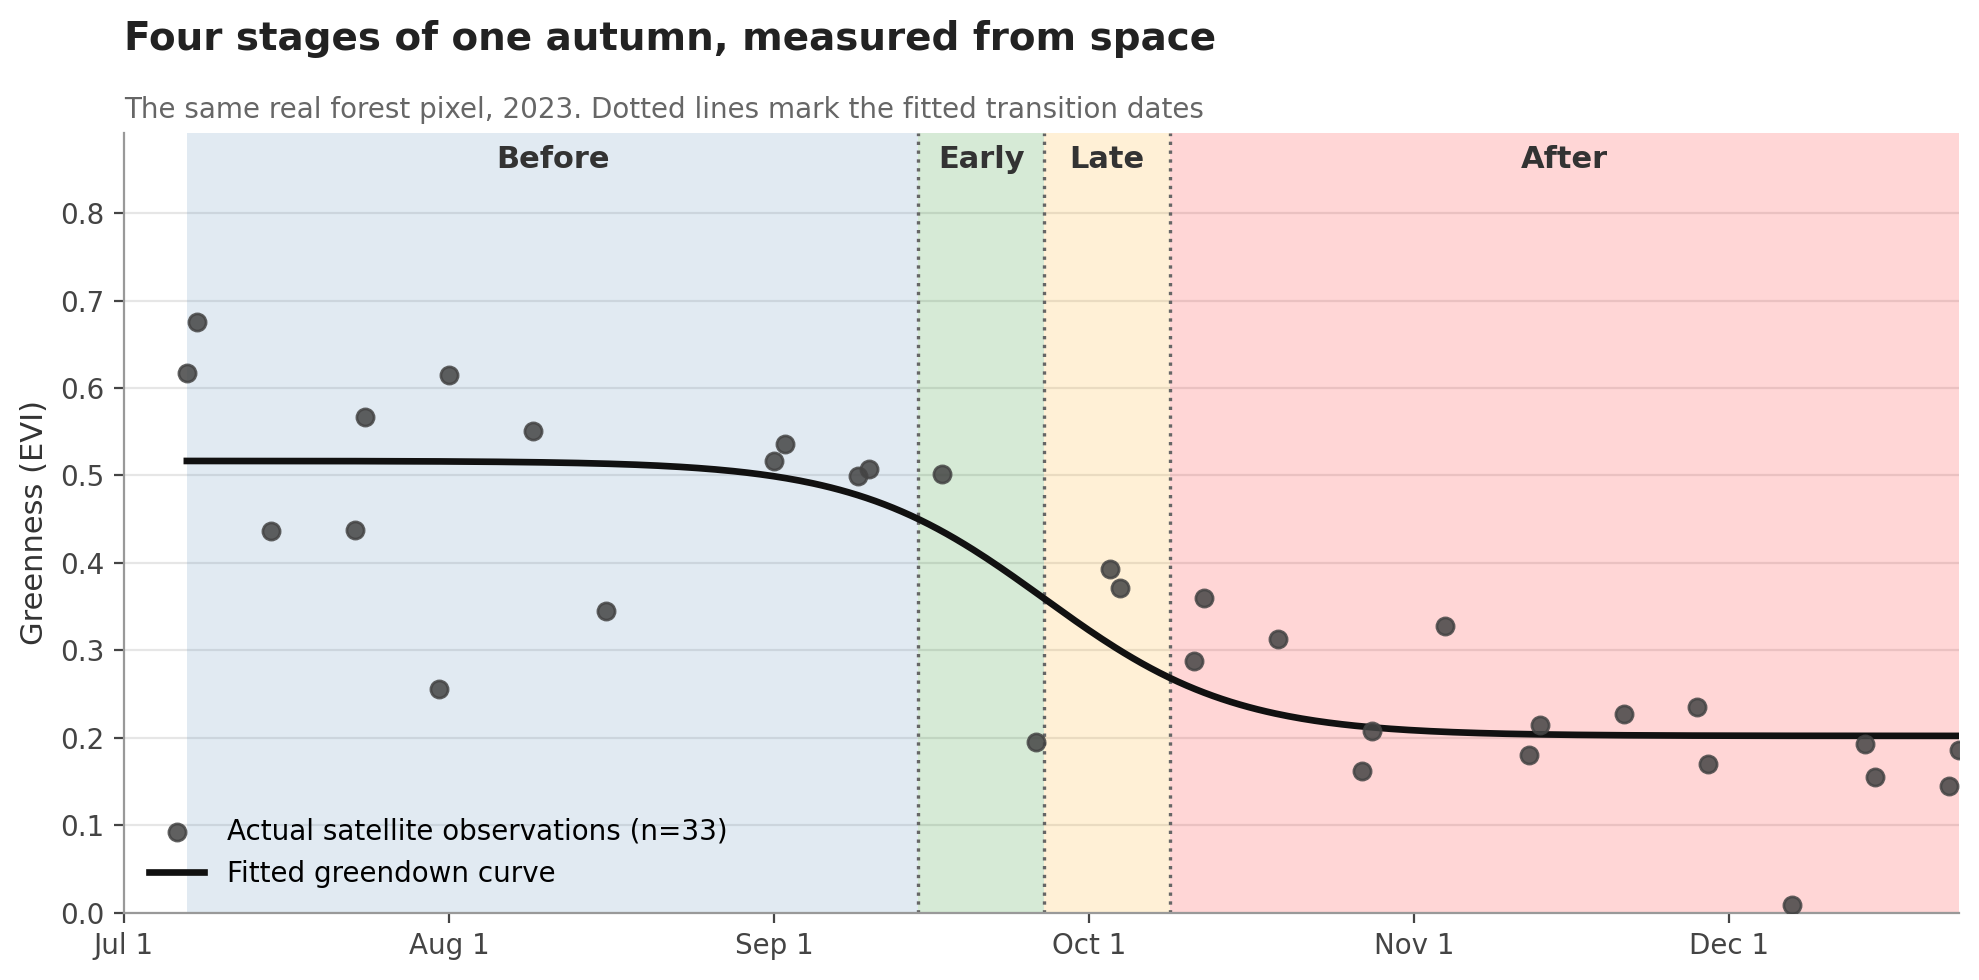
The same pixel across the full season, shaded by the four states the models predict.
Of course it is green in July
The tool runs from July 1 through December 31. During most of those six months, deciduous trees are either fully green or completely bare, apart from a few species that hold onto brown leaves throughout the winter. No one is waking up early before a hike to check if the leaves are still green in July, though. What matters is the short period when the leaves are actually changing, plus the days right before and after. Predicting early and late greendown is more useful than predicting, for the 50th day in a row, that the leaves are still green. These two classes, however, are also the rarest, which complicates model selection. A model can post a better overall accuracy score by predicting the easy months well but be less reliable during the periods I care about. Because of this, when comparing models, I also assessed how well each one predicted early and late color change via the class precision metrics, not just overall accuracy.
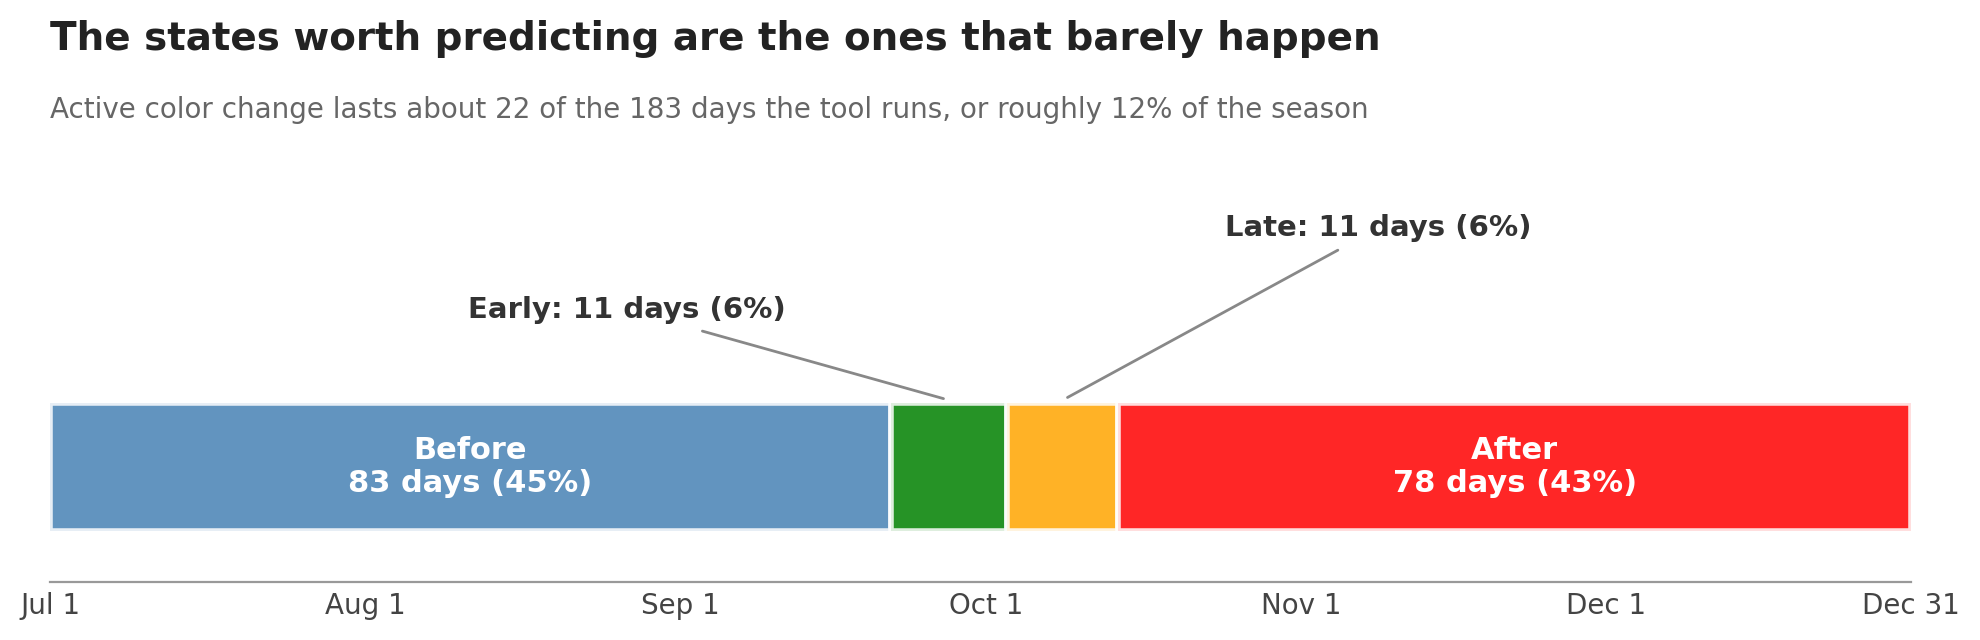
Active color change covers about 22 of the 183 days the tool runs.
Training models
As inputs I gave the models current greenness, how much it had shifted over recent observations, day length, recent temperature, and how far the date was from that pixel's typical timing for peak color. I used two types of machine learning models because they approach the problem differently. The first was a decision tree, which classifies observations by applying a series of yes/no threshold rules to the input features. These are interpretable, meaning you can read the logic directly: one rule might check whether day length has fallen below a certain value. The second was a recurrent neural network (RNN), which processes observations as a time series, drawing on the history of prior observations within a season. Neural networks, by contrast, are black boxes. You cannot see why they landed on a given answer. For both, I trained several versions with different settings, adjusting things like how much the model was allowed to memorize.
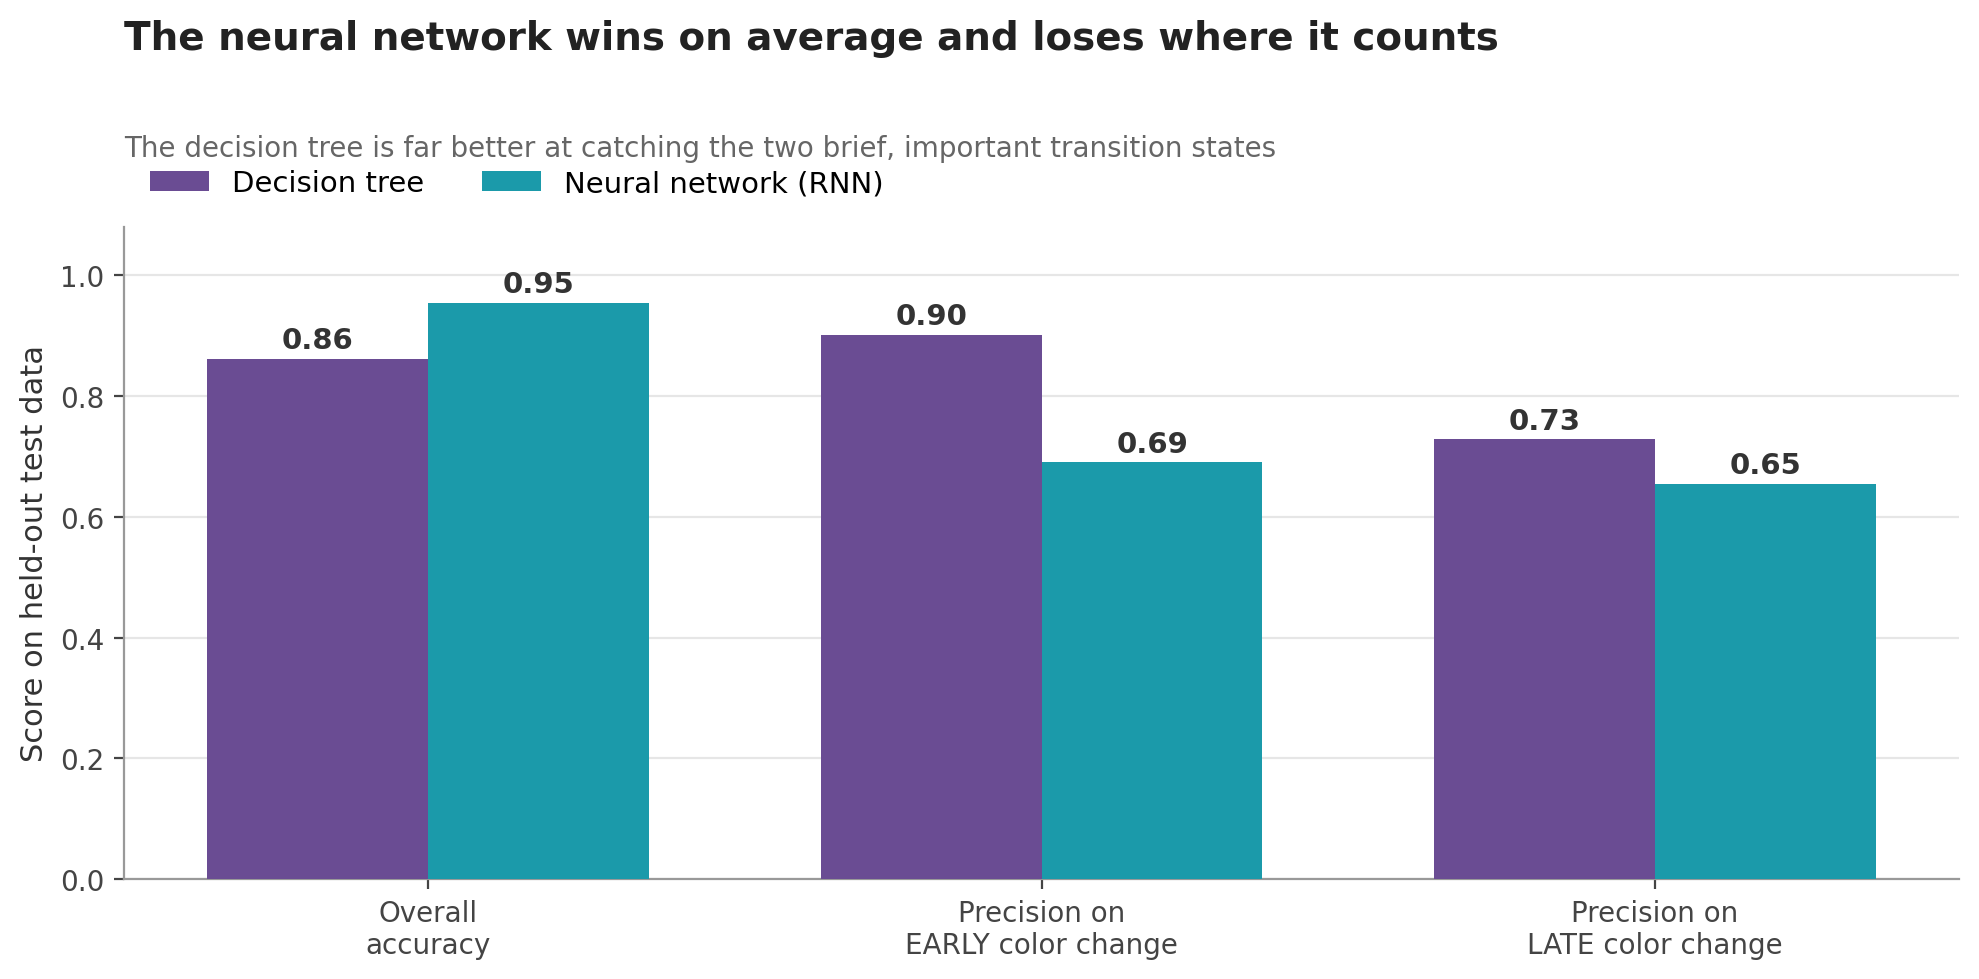
The neural network scores higher overall, but the decision tree is better on the two brief transition states.
Predicting early and late color change is more important
The RNN won on overall accuracy, but the decision tree was better at picking out the early and late color change states. Those are the ones that matter. Decision trees typically handle small, imbalanced data well, while the RNN optimizes average accuracy across the whole season. If I had prioritized overall accuracy, I could have selected a model that excelled in the easy months but that missed the short, critical time that leaf peepers care about. Each model has its own strength, so I kept both in the tool.
Model limitations
I built the training and test labels by fitting greendown curves to determine the start, middle, and end of color change. This means that the states are directly tied to how fast greenness is changing and not necessarily to whether a person standing on the trail would actually see color. Because the periods of greendown are brief and peak color should fall near the midpoint, the two should line up reasonably well. But I have not included direct human observations yet. Maybe this gives me an excuse to hike more this fall!
I also split the data randomly instead of holding out whole years, so the models were tested on seasons they had already partly seen. Real performance on a new autumn is therefore probably worse than the numbers here suggest. That is something I plan to change in the next version.
The models were also trained only on Massachusetts data, and I would not transfer them to another region without retraining. Forests elsewhere have different species mixes, different climates, and potentially different color change cues.
What is next
I only used a small fraction of the satellite data that are available. In future iterations, I plan to bring in a wider variety of sensors. One option is satellite embeddings, which are compact lists of numbers produced by a large machine learning model that summarizes a lot of data across an entire year. Google recently published satellite embeddings as an Earth Engine dataset, and I have used them in an Oregon land cover change project.
Because they are annual products, they cannot directly tell us what is changing day to day. However, embeddings from a previous year could still give meaningful information about a patch of forest, such as which species live there. More predictors should help the models, which still struggle with late color change: more than one in four of the decision tree's past-peak predictions are wrong, and closer to one in three of the RNN's.
Just because satellite data suggest that the leaves are changing color does not mean that you can see those leaves from the trail. They might be hidden behind a steep slope or a stand of taller green trees. I plan to incorporate canopy height and elevation models so predictions better reflect what a hiker is actually seeing, assuming they are not a 200-foot-tall giant.
For the people!
The main goal of this project is to give people (mostly my friends, because I am admittedly not the best advertiser) a place to check color conditions before a hike, and maybe to pick a different section of trail if they want to catch the leaves actually turning. I ran the computationally expensive steps on my own computer, fitting the models and calculating the historical averages, and a quick GitHub Action pulls the latest imagery to make a new prediction every day. I made most of the decisions and did the writing myself, but this project also gave me a chance to try using Claude Code to speed up the coding (especially building the webpage). All of the code for this project, including the daily update workflow, is on GitHub. I am always open to feedback, so feel free to email me with any suggestions. Thanks for checking it out!