My work focuses on how human impacts such as climate change and environmental contamination affect ecosystems. Much of my formal training focused on plant phenology, the timing of recurring biological events like leaf-out and senescence, which is one of the most sensitive and widely used indicators of climate change, and a key driver of the carbon, water, and energy cycles that regulate our climate. Understanding and predicting phenology means combining large, messy environmental datasets with rigorous statistical and machine learning methods, which is what drew me to data science in the first place.
Below are examples of my research and applied projects, spanning Bayesian and machine learning models, custom statistical algorithms, remote sensing, and geospatial analysis.
Modeling Senescence: A Trigger-Free, Physiology-Based Approach
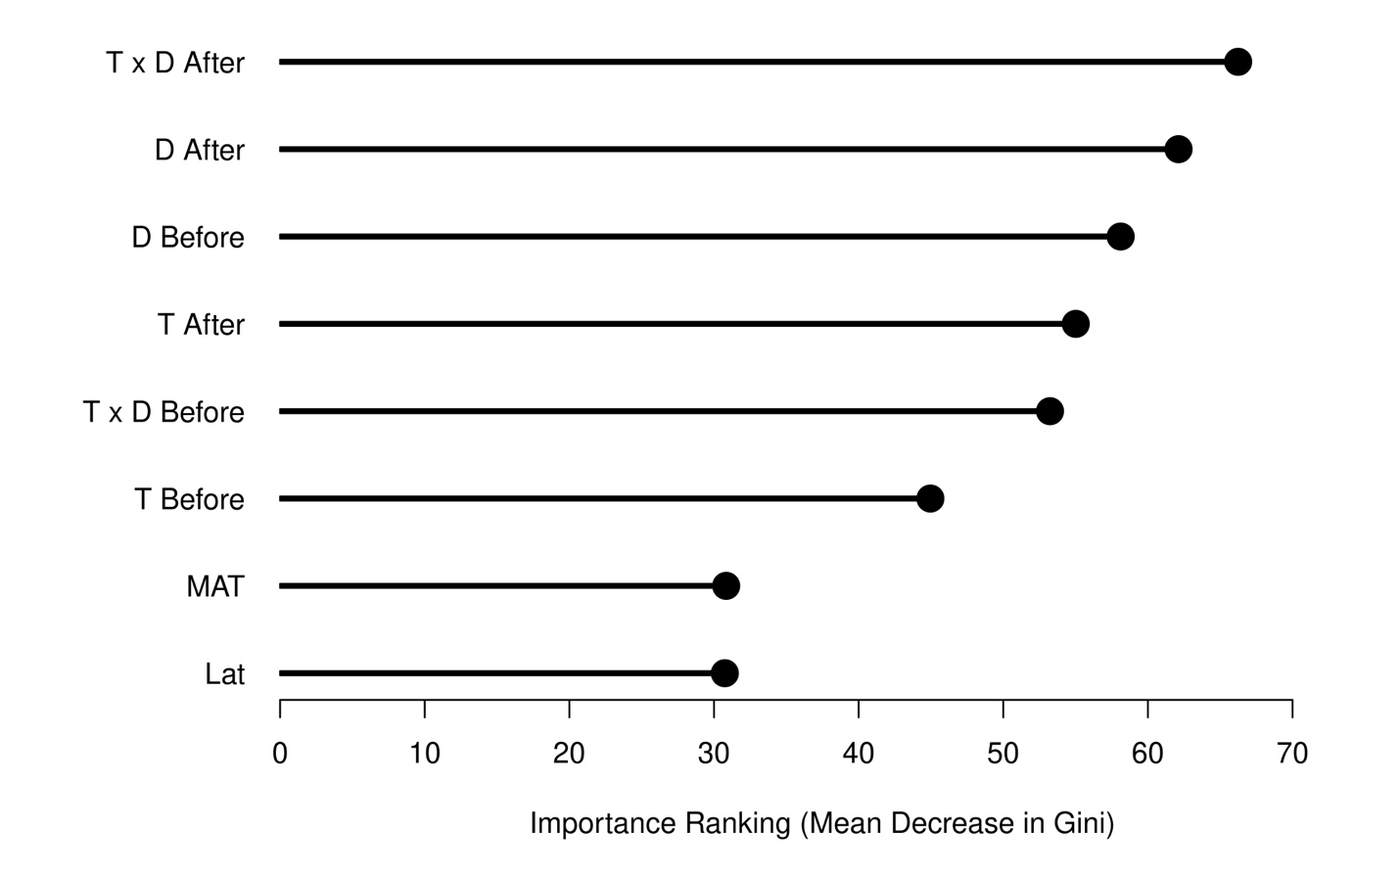
View preprintMost phenology models represent the onset of autumn senescence as a threshold response triggered by cold accumulation, but the physiological mechanisms behind that trigger remain unclear. For my Ph.D. research, I developed a dynamic Bayesian state-space model that predicts daily canopy greenness as the balance between temperature- and photoperiod-driven chlorophyll synthesis and constant breakdown, without assuming any trigger or memory of past conditions. Fit to 24 PhenoCam sites, the model successfully predicted the start of senescence using only pre-senescence data in roughly half of site-years. A random forest analysis further showed that environmental conditions in the week after a potential inflection date were more important predictors of senescence onset than conditions before it, supporting the idea that senescence is a continuous response to shifting conditions rather than a fixed, irreversible trigger.
Predicting Spring Phenology: NEON Forecasting Challenge
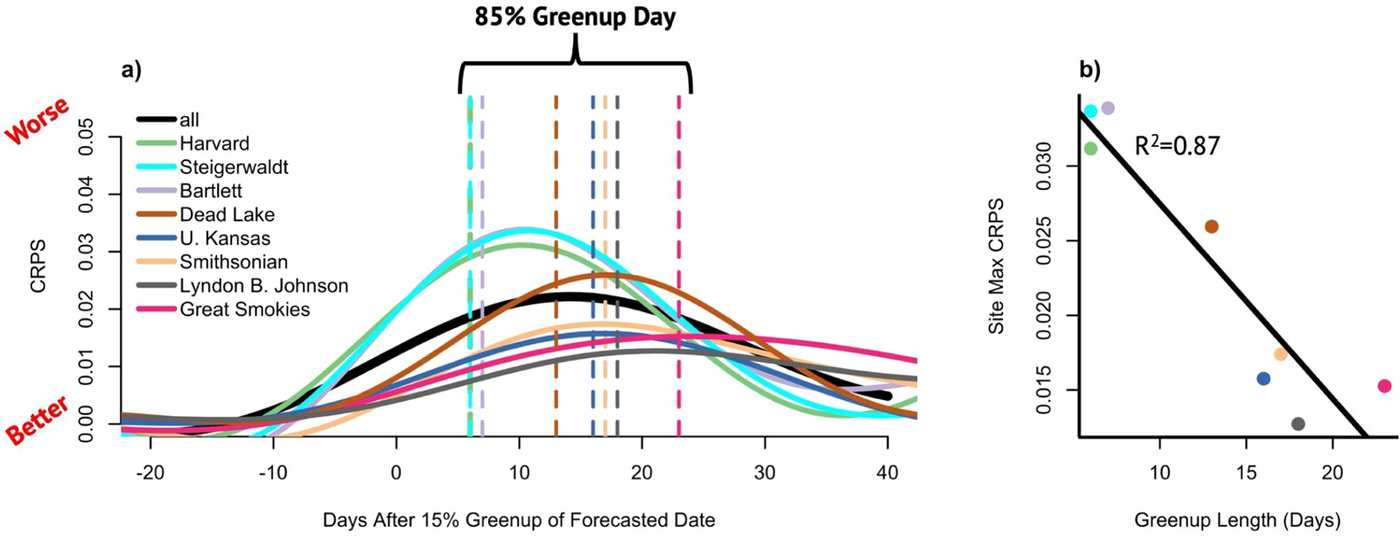
View paperAs part of the Ecological Forecasting Initiative's NEON Phenology Forecasting Challenge, I helped coordinate and analyze an open community challenge asking researchers to forecast daily canopy greenness at eight NEON sites before the data were collected. Across 18 models and over 192,000 individual forecasts, Generalized Additive Models (GAMs) were used to characterize how forecast skill varied by lead time, forecast timing, and site. We found that skill was highest earlier in green-up, at shorter lead times, and away from the onset of budburst. The GAM framework let us tease apart these overlapping, nonlinear effects across many models simultaneously rather than fitting each comparison separately.
A Statistical Algorithm for Daily NDVI from Noisy Satellite Data
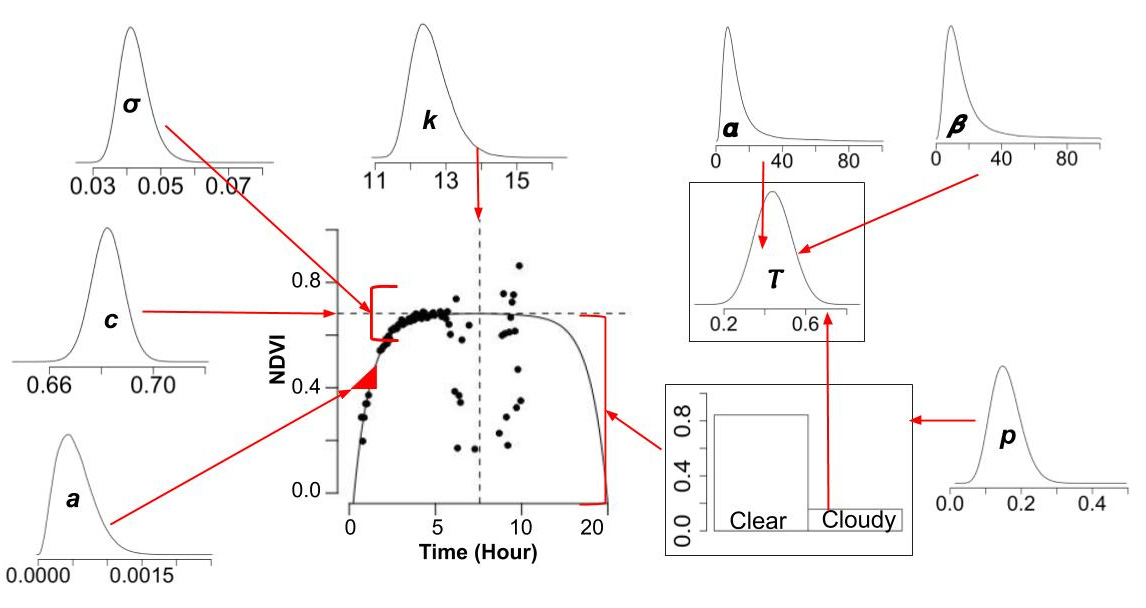
View paperHigh-frequency GOES satellite data offers a new way to track vegetation greenness, but individual NDVI observations are noisy due to atmospheric scattering and cloud contamination. I designed and implemented a custom statistical algorithm that fits double-exponential curves to each day's diurnal NDVI pattern, producing a single daily NDVI estimate with a rigorous, propagated uncertainty range instead of relying on one noisy observation. Applied across 350 days at fifteen deciduous broadleaf sites, the algorithm produced confident daily estimates roughly 72% of the time, turning high-frequency but noisy raw satellite data into a usable, uncertainty-aware research product.
Monitoring Forest Phenology with Geostationary Satellites
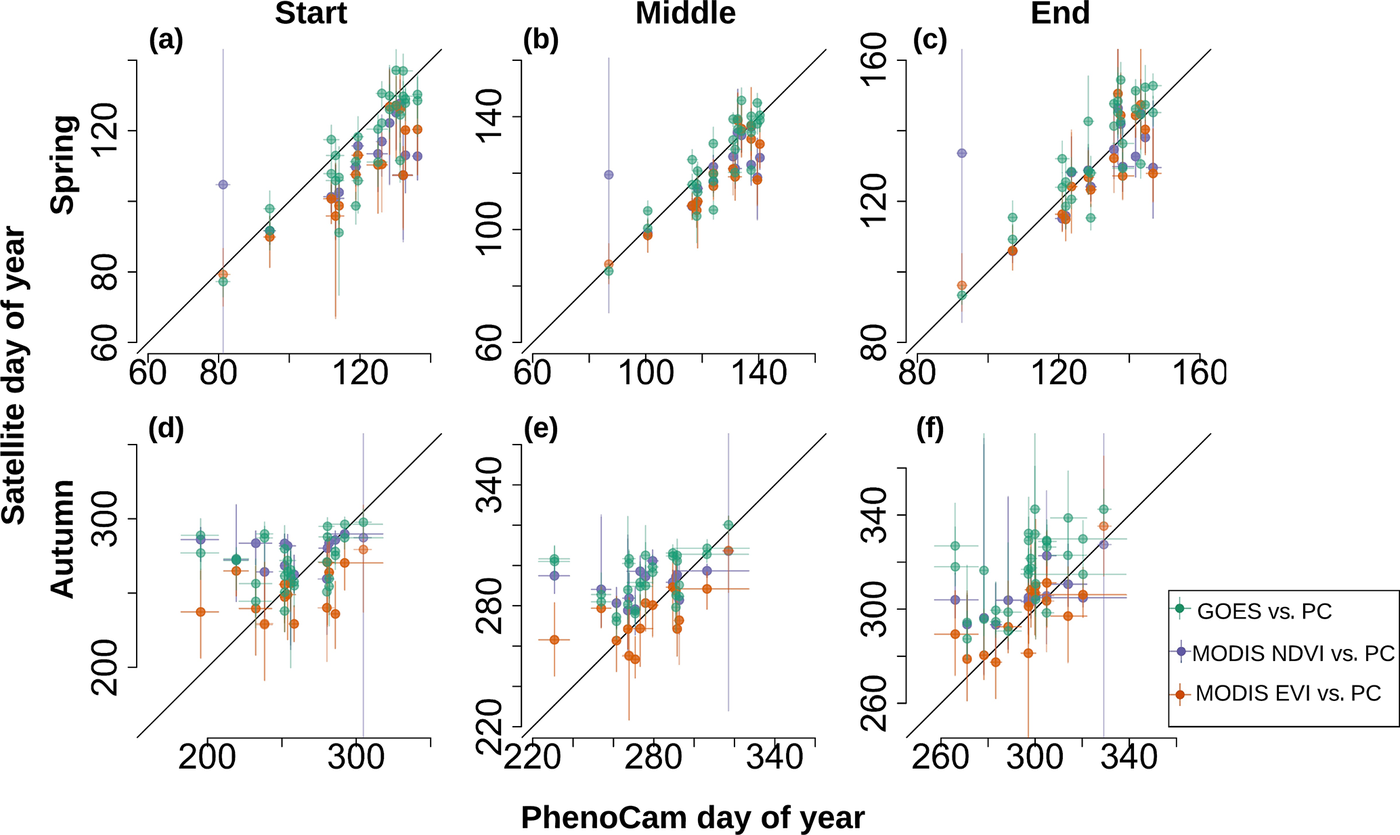
View paperGround-based PhenoCam networks provide high-frequency phenology data but limited spatial coverage, while satellites like MODIS cover the globe at only 16-day resolution. I evaluated whether the newer GOES-16 and GOES-17 geostationary satellites, which can observe vegetation every five to ten minutes, could close that gap. Fitting double-logistic Bayesian models to two years of GOES, MODIS, and PhenoCam data across many deciduous broadleaf sites, I found GOES-derived spring transition dates were more closely correlated with PhenoCam ground truth than MODIS, particularly at the start and middle of green-up, demonstrating the potential for near-real-time, broad-scale phenology monitoring.
Leaf Phenology and Ecohydrology: PARAFAC & Self-Organizing Maps
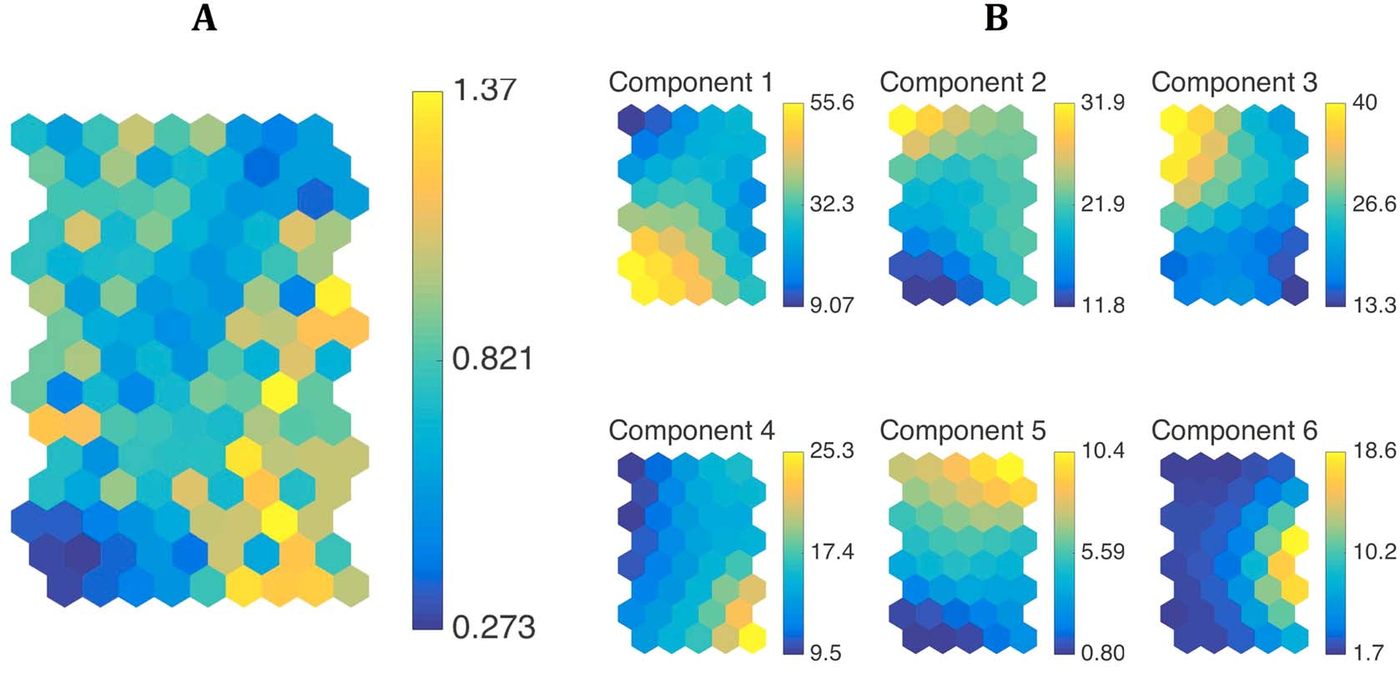
View paperAs leaves senesce, the dissolved organic matter released by leaf litter into forest streams changes in ways that were poorly understood. I built a six-component parallel factor analysis (PARAFAC) model to decompose fluorescence signatures of leaf litter leachate collected from beech and yellow poplar trees across four states, then applied self-organizing maps (SOMs), an unsupervised machine learning technique, to cluster and visualize how PARAFAC component proportions shifted across sites, species, and senescence stages. The SOM analysis revealed clear, nonlinear groupings in leachate chemistry tied to geographic origin and phenological stage that would have been difficult to detect with linear multivariate methods alone.
Hyperspectral Indices for Predicting Leaf Nitrogen
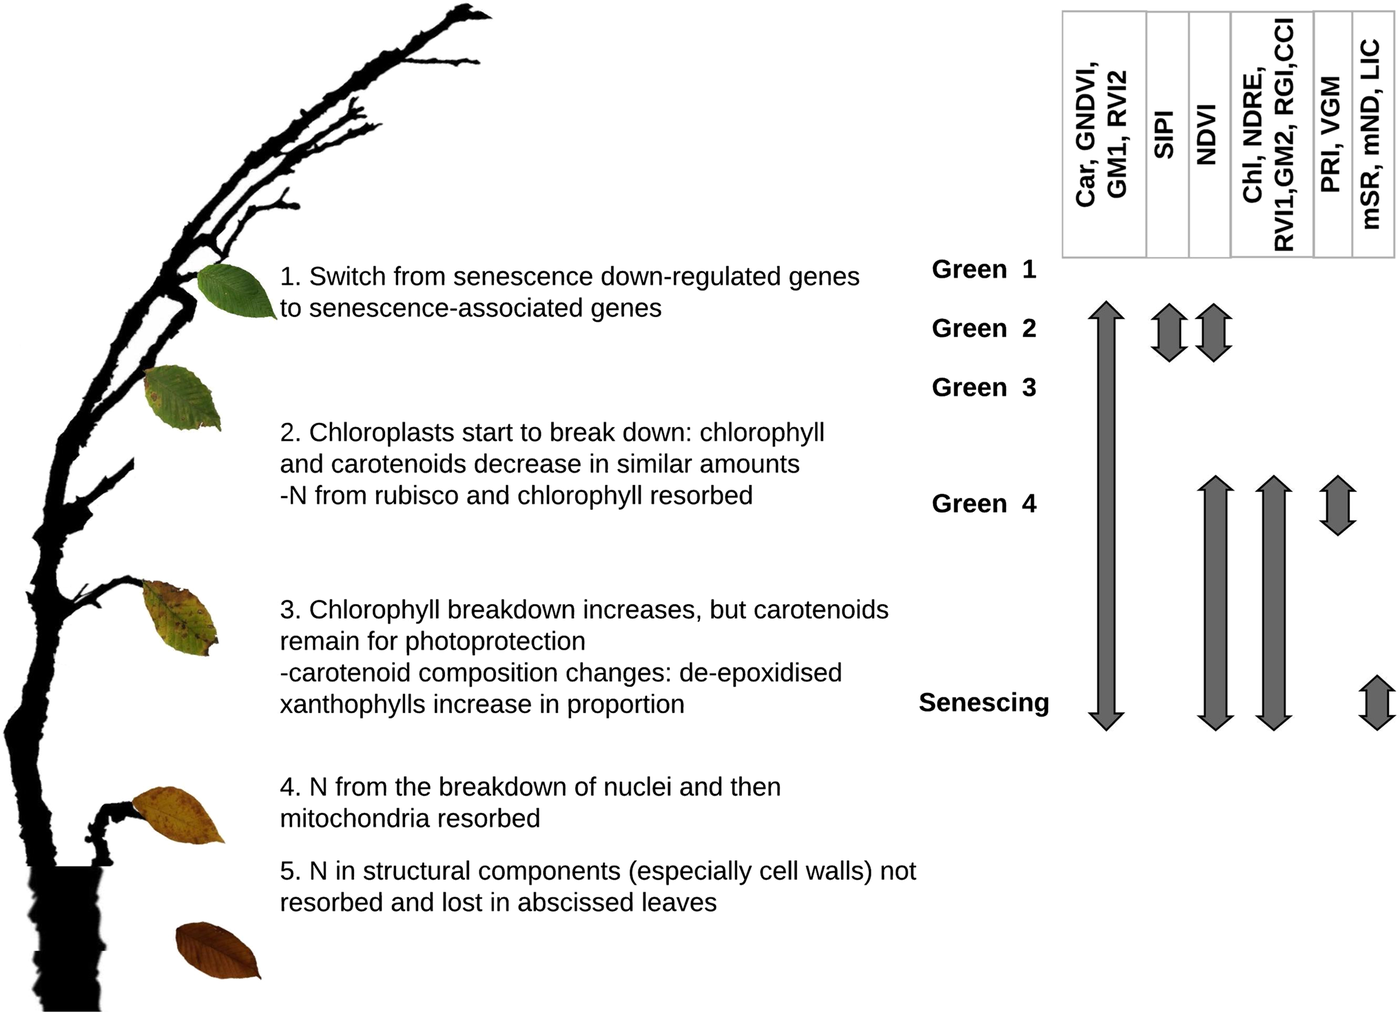
View paperAs an undergraduate thesis project, I tested how well published hyperspectral vegetation indices, spanning the visible and near-infrared spectrum, could predict leaf nitrogen concentration in the lower forest canopy, a trait that is understudied relative to sunlit upper-canopy leaves. Using a Bayesian framework applied to three species from mid-summer through senescence, I found that indices incorporating the red-edge and near-infrared wavelengths were the strongest and most consistent predictors of nitrogen decline through the autumn transition, while indices based on visible wavelengths alone performed poorly.
Leaf Phenology and Soil Properties
As the global climate changes, it is becoming more important to understand the uncertain role that the terrestrial biosphere has on carbon storage. Since warmer temperatures affect the timing of phenology transitions in plants, plant phenology is a primary ecological indicator of climate change. Furthermore, how sensitive phenology transitions are to different drivers (e.g., temperature, photoperiod, water availability, leaf age limitations) is highly variable and depends on species and latitude. Without understanding how sensitive phenology is to drivers, we cannot make accurate predictions of phenology and, thus, annual primary productivity.
In my postdoctoral fellowship work, I was interested in how various soil properties including carbon to nitrogen ratios, soil moisture, and soil fungi called mycorrhizae impact phenology. Over 80% of plant species associate with soil fungi called mycorrhizae, which increase access to limiting resources such as nutrients (e.g., nitrogen, N) and water. Soil microbes (e.g., mycorrhizae fungi) significantly impact plant phenology events (e.g., flowering) in over 88% of published studies, but their effect on leaf phenology is rarely studied (O'Brien et al., 2021, Am. J. Bot). I investigated if mycorrhizae association of plants affects the sensitivity of leaf phenology in plants to environmental drivers and the resultant carbon fluxes.
Appalachian Trail Fall Phenology
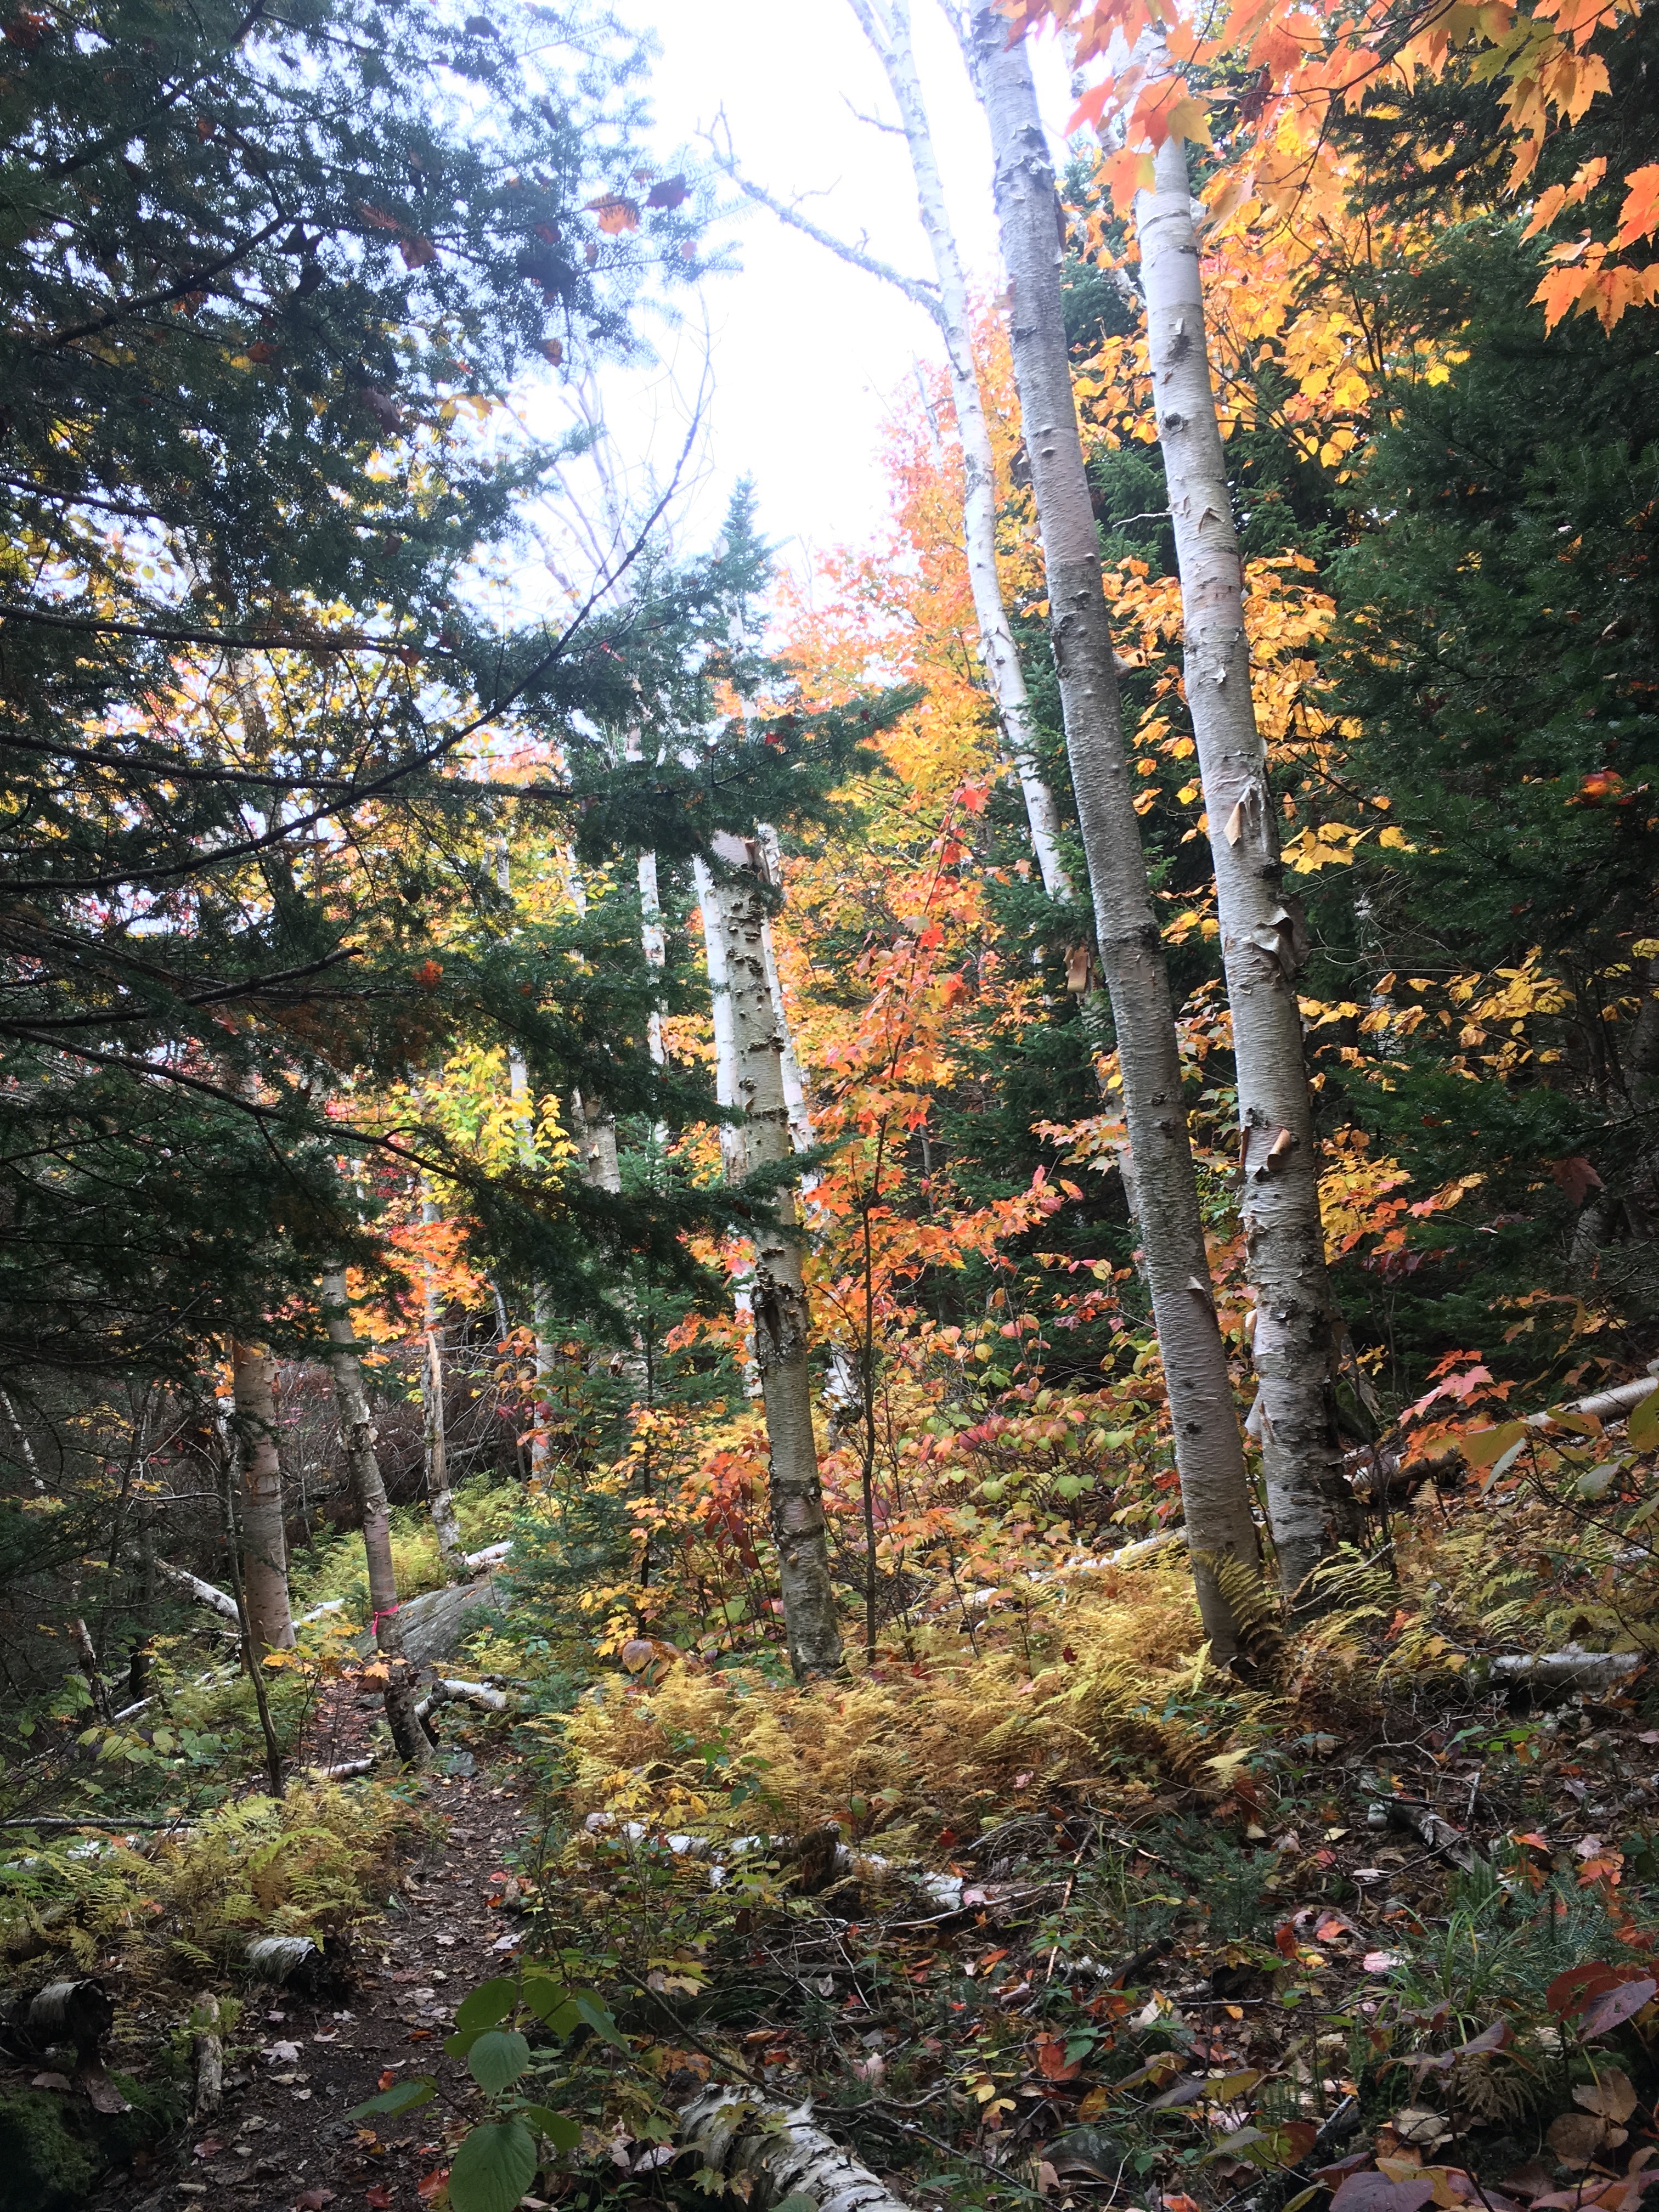
To keep building hands-on machine learning and geospatial skills, I built a live tool that predicts the current fall phenological state along the Appalachian Trail in Massachusetts. It pulls satellite imagery from Google Earth Engine, then feeds vegetation and timing features into both a decision tree classifier and a two-layer LSTM (a recursive neural network) trained on ten years of historical data, updating its predictions daily. I used Claude Code throughout development, from data pipelines to deployment, while still directing the architecture, model selection, improvement, and evaluation, and troubleshooting the Google Earth Engine and GitHub permissions myself.
Mapping Forest Change and Carbon Loss in Oregon
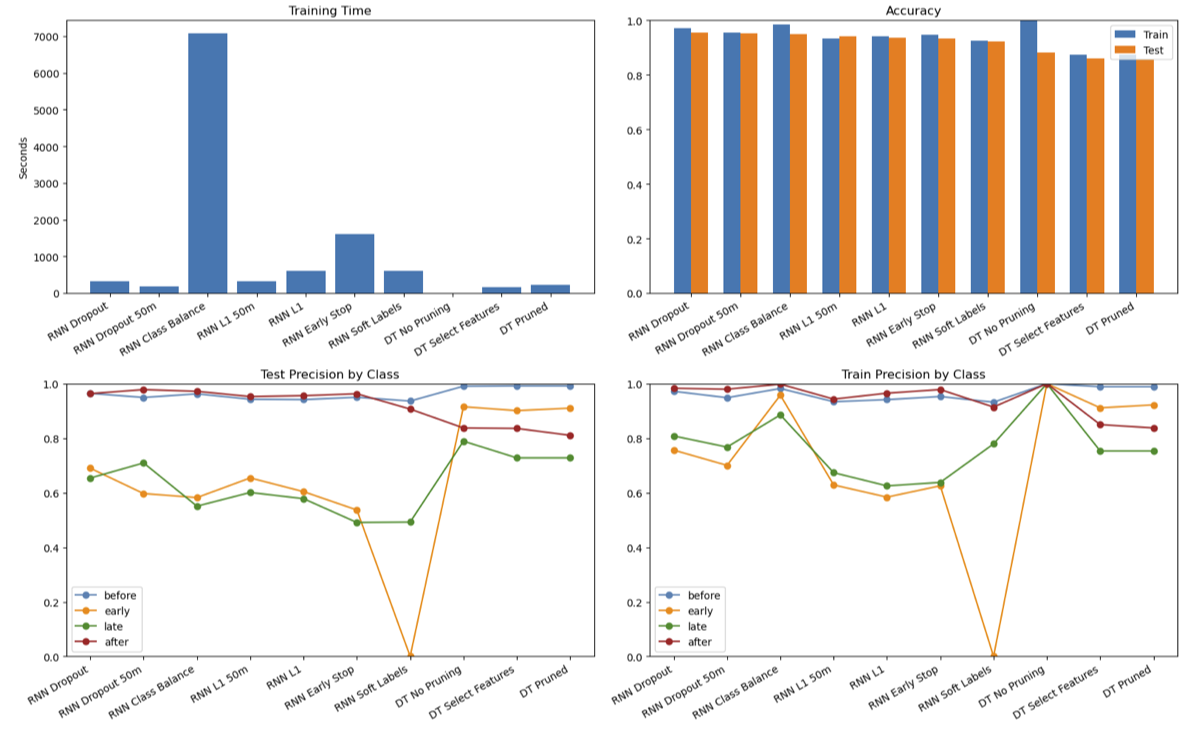
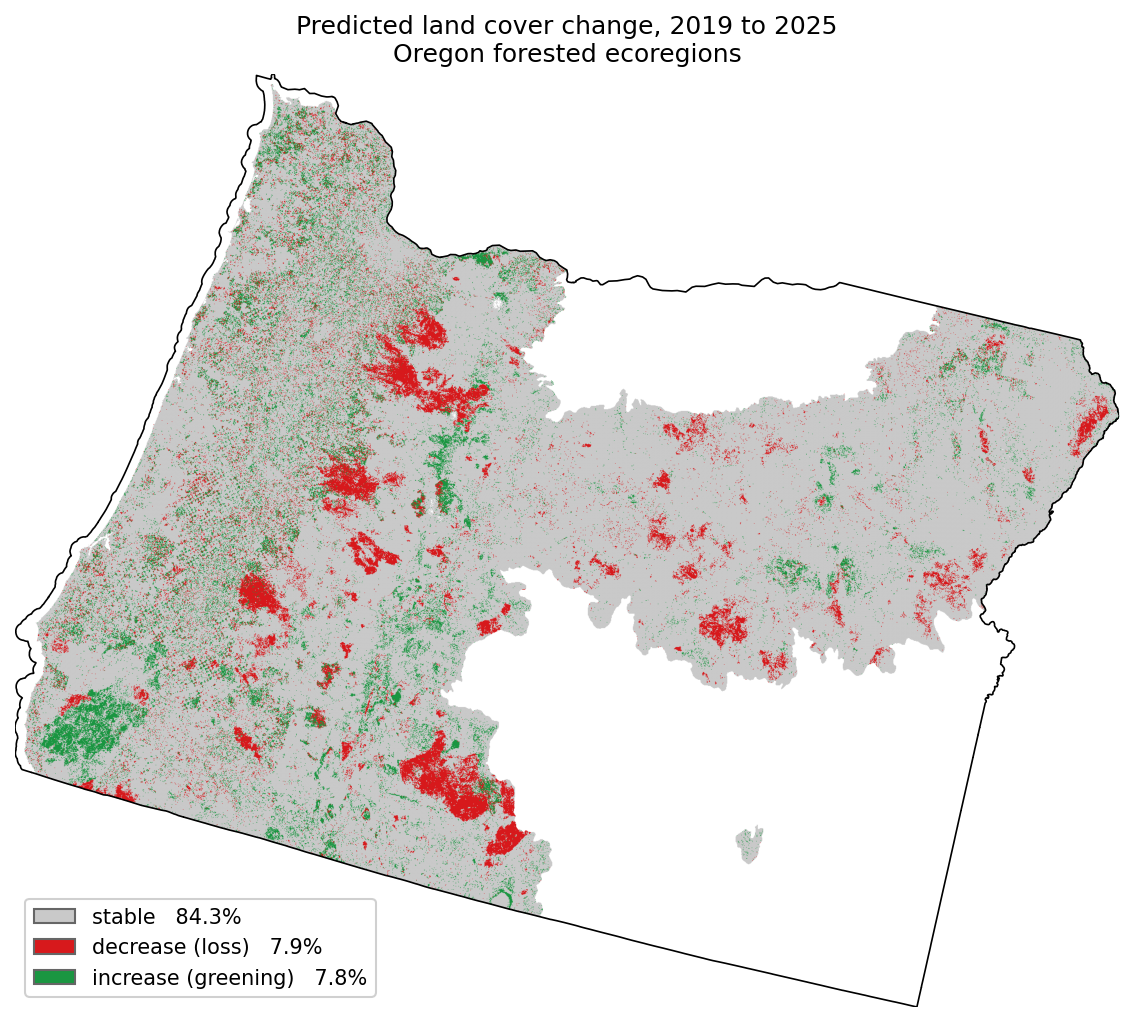
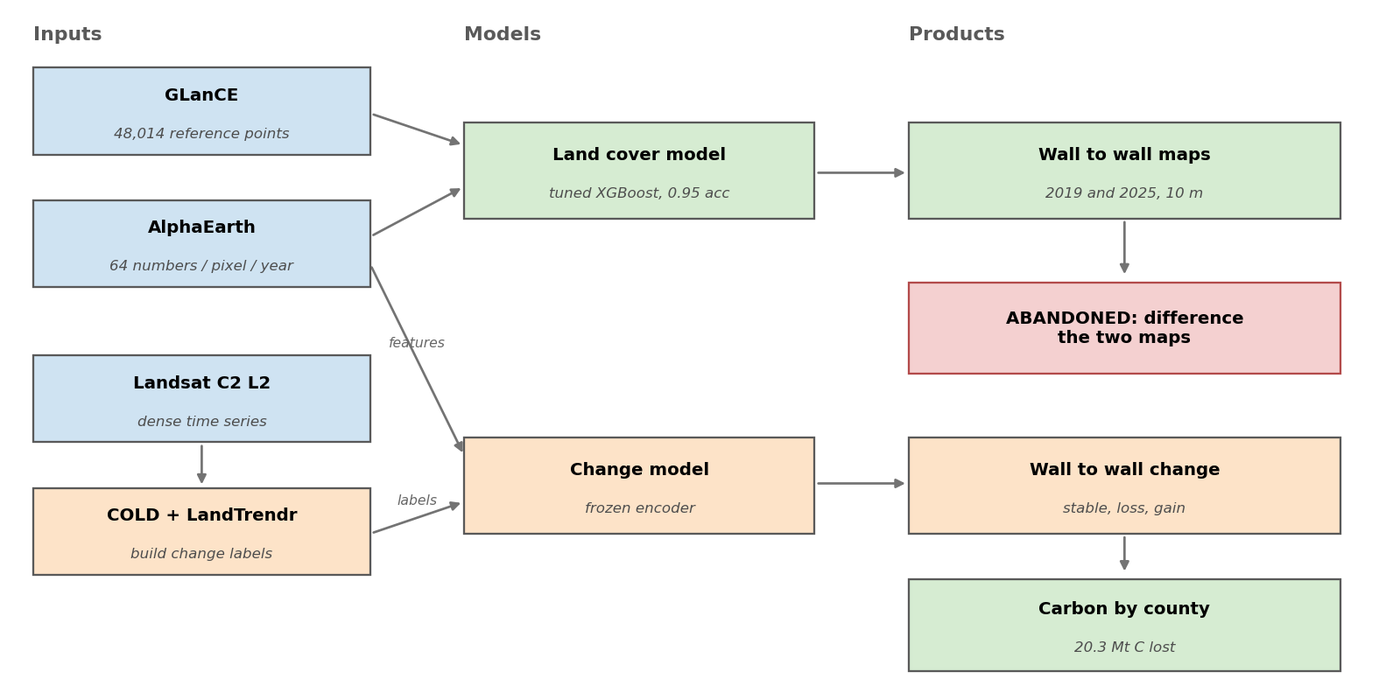
Read full analysisI built an end-to-end geospatial machine learning pipeline to map forest cover change and estimate carbon loss across Oregon's forested ecoregions from 2019 to 2025. Using Google DeepMind's AlphaEarth satellite embeddings from Google Earth Engine, I trained and compared nine model variants for land cover classification (a tuned XGBoost model won, at 0.95 accuracy) and five architectures for change detection, where a frozen-encoder neural network that reads paired before and after embeddings directly outperformed the conventional approach of differencing two classified maps, cutting false alarms roughly in half. Applying design-based statistical estimation to correct for mapping error, the analysis estimates 827,886 ha of forest lost, holding 20.3 million Mg of aboveground carbon (95% CI 14.2 to 26.4 million) before deforestation.
Natural Resource Damage Assessment
Natural Resource Damage Assessments (NRDAs) are the legal and scientific process used to evaluate injuries to natural resources, such as fish, wildlife, and habitats, caused by hazardous substance releases, and to determine the restoration needed to compensate the public for those losses. I use R, Python, and ArcGIS Pro to process and analyze spatial-temporal environmental data supporting NRDAs at several Superfund sites, applying advanced statistical methods, including inverse distance weighting, distributed lag time-series models, PCA, mixed-effects models, generalized estimating equations, and non-negative matrix factorization, to estimate contaminant impacts on fish populations. I also use machine learning (decision trees and k-means clustering) to identify patterns in complex environmental datasets, improved the efficiency of a client-facing R Shiny data visualization app by 5x, and automated a client-preferred workflow with Python, saving 120+ hours of manual work. I regularly translate technical findings into clear reports and presentations for clients with limited technical backgrounds. Specific findings and client details are confidential.
Other Publications
Additional peer-reviewed publications not detailed above as their own projects. See the full list on Google Scholar.
Ecosphere · 2023
B.S. Halpern et al. [including K.I. Wheeler] (2023). Ecosphere. 14(1):e4342.
Canopy structure metrics governing stemflow funnelling differ between leafed and leafless states: Insights from a large-scale rainfall simulator
Hydrological Processes · 2021
S. Iida*, K.I. Wheeler*, K. Nanko, Y. Shinohara, X. Sun, N. Sakai, D.F. Levia (2021). Hydrological Processes 35:e14294. *Equal contribution.
Frontiers in Ecology and the Environment · 2021
C.R. Rollinson, A. Finley, M.R. Alexander, et al. [including K. Wheeler] (2021). Frontiers in Ecology and the Environment 19(1): 66-72.
PLoS Computational Biology · 2021
W.M. Woelmer, L.M. Bradley, L. Haber, D. Klinges, A.S.L. Lewis, E. Mohr, C.L. Torrens, K.I. Wheeler, A.M. Willson (2021). PLoS Computational Biology 17(10): e1009440.
Oxford Bibliographies · 2018
M.C. Dietze, C. Averill, J. Foster, K. Wheeler (2018). Oxford Bibliographies. DOI: 10.1093/OBO/9780199830060-0205.